
Dependent T Test Calculator
Introduction
In the realm of statistical analysis, the dependent t-test serves as a crucial tool for comparing the means of two related groups. Understanding its application and employing an accurate calculator can streamline the analysis process significantly.
How to Use
Utilizing a dependent t-test calculator involves inputting the necessary data, including the means and standard deviations of the two groups, along with the sample size and correlation coefficient. With this information, the calculator can determine the t-value and corresponding p-value, aiding in the assessment of the significance of the observed differences between the groups.
Formula
The formula for calculating the t-value in a dependent t-test is:
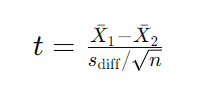
Where:
- Xˉ1 and Xˉ2 are the means of the two groups,
- diffsdiff is the standard deviation of the differences between the pairs, and
- n is the number of pairs.
Example Solve
Let’s consider an example where we have the following data:
- Mean of Group 1 (Xˉ1): 25
- Mean of Group 2 (Xˉ2): 20
- Standard Deviation of Differences (s diff): 5
- Number of Pairs (n): 30
Plugging these values into the formula:

This yields a t-value of approximately 5.48.
FAQ’s
Q: What is a dependent t-test used for?
A: A dependent t-test is employed to determine whether the means of two related groups differ significantly.
Q: How do I interpret the results of a dependent t-test?
A: The calculated t-value is compared against a critical value from the t-distribution to assess the significance of the observed differences. A lower p-value indicates stronger evidence against the null hypothesis.
Q: Can a dependent t-test be used with small sample sizes?
A: Yes, but it’s important to ensure that the data meet the assumptions of the test, including normality and homogeneity of variances.
Conclusion
The dependent t-test calculator provides a convenient means of analyzing the differences between related groups, aiding researchers and analysts in drawing meaningful conclusions from their data.