
RSI Relative Strength Index Calculator
Introduction:
Calculating the Relative Strength Index (RSI) is vital for traders and investors in financial markets. RSI is a momentum oscillator that measures the speed and change of price movements. Understanding how to use an RSI calculator can assist in making informed decisions when trading stocks, forex, or other assets.
How to Use:
Using the RSI calculator is straightforward. Input the necessary parameters such as the period length and the closing prices of the asset for the desired timeframe. Then, click on the “Calculate” button to obtain the RSI value.
Formula:
The RSI formula is as follows:
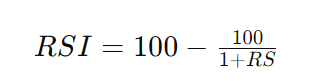
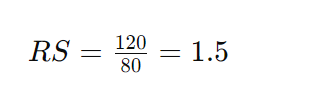
Where RS (Relative Strength) is calculated as:

Example Solve:
Suppose we want to calculate the RSI for a stock with closing prices over 14 days. The average gain over these 14 days is 120 points, and the average loss is 80 points.
Using the formula:
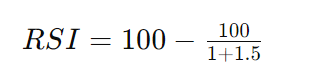

Therefore, the RSI for this stock is 60.
FAQs:
Q: What is the significance of RSI in trading?
A: RSI helps traders identify overbought or oversold conditions in an asset, which can indicate potential trend reversals.
Q: What is a typical period length used when calculating RSI?
A: The default period length for RSI calculations is often 14 days, but traders may adjust it based on their trading strategies and preferences.
Q: How should traders interpret RSI values?
A: RSI values above 70 are typically considered overbought, suggesting a potential reversal to the downside. Conversely, RSI values below 30 are considered oversold, indicating a possible reversal to the upside.
Conclusion:
In conclusion, the Relative Strength Index (RSI) calculator is a valuable tool for traders seeking to gauge the momentum of price movements in financial markets. By understanding how to interpret RSI values, traders can make informed decisions to optimize their trading strategies.